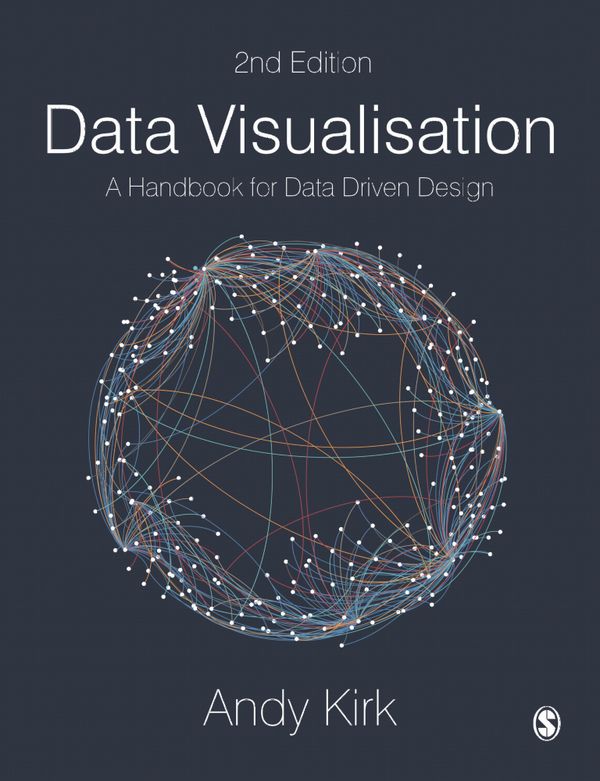
Data Visualisation | 2:a upplagan
- Danskt band, Engelska, 2019
- Författare: Andy Kirk
- Betyg:
Butikslager
Onlinelager
Ej i lager
Fler utgåvor
Beskrivning
One of the "six best books for data geeks" - Financial Times
With over 200 images and extensive how-to and how-not-to examples, this new edition has everything students and scholars need to understand and create effective data visualisations.
Combining ‘how to think’ instruction with a ‘how to produce’ mentality, this book takes readers step-by-step through analysing, designing, and curating information into useful, impactful tools of communication.
With this book and its extensive collection of online support, readers can:
Decide what visualisations work best for their data and their audience using the chart gallery
See data visualisation in action and learn the tools to try it themselves
Follow online checklists, tutorials, and exercises to build skills and confidence
Get advice from the UK’s leading data visualisation trainer on everything from getting started to honing the craft.
Produktinformation
Kategori:
Okänd
Bandtyp:
Danskt band
Språk:
Engelska
Förlag:
Okänt
Upplaga:
2
Utgiven:
2019-08-21
ISBN:
9781526468925
Sidantal:
328
